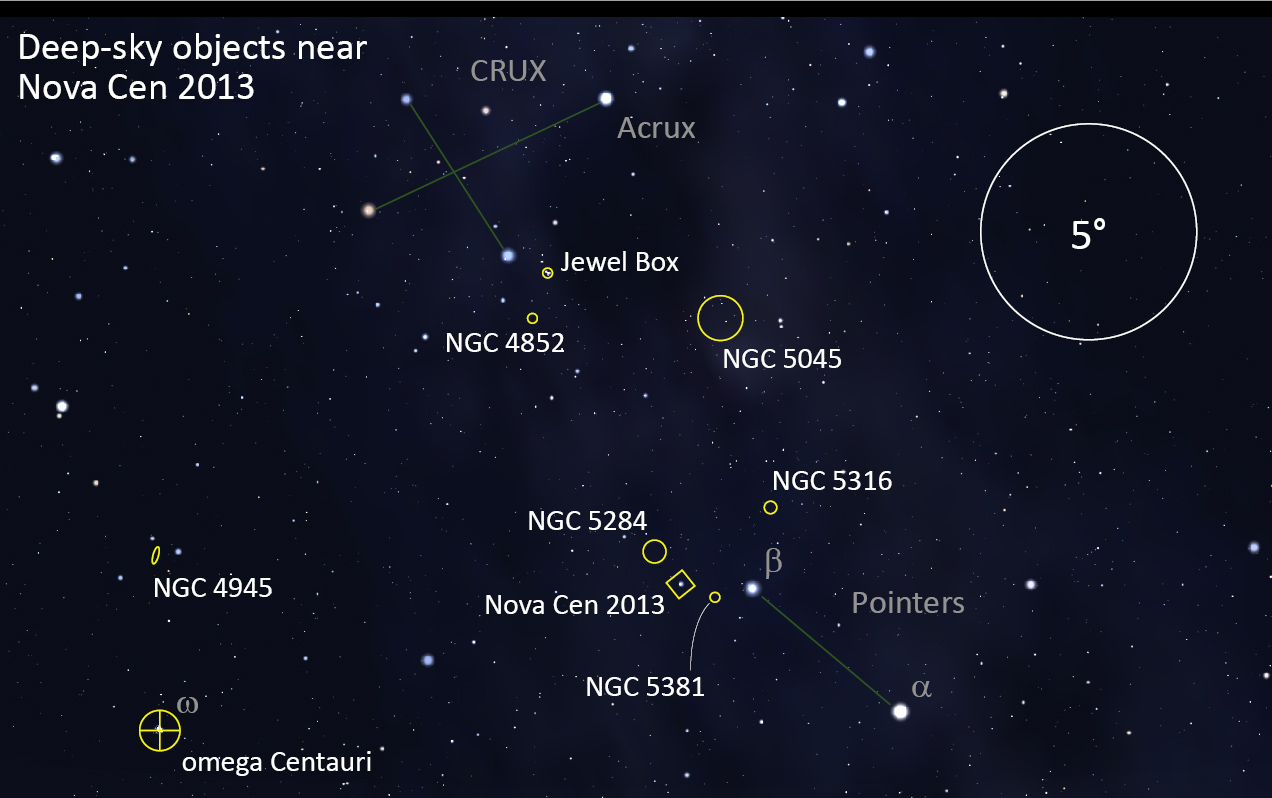
On Monday, 2013 December 02, John Seach (Chatsworth Island, NSW, Australia) discovered a nova in Centaurus. Located less than 2° from beta Centauri, the nova brightened to become a naked-eye target. It has now (early-February) faded to just beyond the limit of naked-eye visibility.

In the finder chart above, Nova Cen 2013 is the bright star within the yellow 30′ square. Detailed finder charts, courtesy of the AAVSO, show this 30′ field, and a narrower 7.5′ field. The nova has been assigned the designation V1369 Cen.
Observing the nova and making brightness estimates

AAVSO comparison star chart for Nova Cen 2013. Right-Click and Save-As on the image to get the full resolution version. Find out more at the Variable Star Plotter.
Dave Blane, Director of the Shallow Sky Section, has this advice for first-time variable star observers:
“To begin, the best thing to do would be to log on to the AAVSO site, click on “Observing” and download the Observing Manual. Then look at “Making Observations” (chapter 3). This gives a detailed explanation of how to choose comparison stars to make an estimate.
“Suitable comparison stars [with magnitudes in brackets] when the nova is very bright: Zeta Cen (2.54), Delta Cru (2.79), Beta Mus (3.05), Nu Cen (3.41), Gamma Mus (3.85), Zeta Cru (4.04) and Eta Cru (4.14). As it fades we can use the [accompanying] chart.”
Latest results
- 2014 Jun 02 20.1h SAST – Dave Blane, Johannesburg. V = 7.8
- 2014 May 28 20.0h SAST – Dave Blane, Johannesburg. V = 7.8
- 2014 May 26 20.1h SAST – Dave Blane, Johannesburg. V = 7.8
- 2014 May 24 19.5h SAST – Dave Blane, Johannesburg. V = 7.8
- 2014 May 22 20.5h SAST – Dave Blane, Johannesburg. V = 7.8
- 2014 May 21 20.0h SAST – Dave Blane, Johannesburg. V = 7.8
- 2014 May 18 22.2h SAST – Dave Blane, Johannesburg. V = 7.8
- 2014 May 16 20.1h SAST – Dave Blane, Johannesburg. V= 7.8
- 2014 May 13 22.4h SAST – Dave Blane, Johannesburg. V = 7.7
- 2014 May 12 22.5h SAST – Dave Blane, Johannesburg. V = 7.8
- 2014 May 11 19.8h SAST – Dave Blane, Johannesburg. V= 7.8
- 2014 May 09 20.1h SAST – Dave Blane, Johannesburg. V – 7.8
- 2014 May 08 19.8h SAST – Dave Blane, Johannesburg. V = 7.8
- 2014 May 07 22.0h SAST – Dave Blane, Johannesburg. V = 7.8
- 2014 May 06 20.3h SAST – Dave Blane, Johannesburg. V = 7.7
- 2014 May 05 20.5h SAST – Dave Blane, Johannesburg. V = 7.7
- 2014 May 03 20.6h SAST – Dave Blane, Johannesburg. V = 7.7
- 2014 May 02 20.0h SAST – Dave Blane, Johannesburg. V = 7.8
- 2014 May 01 19.5h SAST – Dave Blane, Johannesburg. V = 7.7
- 2014 Apr 30 18.6h SAST – Dave Blane, Johannesburg. V = 7.7
- 2014 Apr 29 19.6h SAST – Dave Blane, Johannesburg. V = 7.7
- 2014 Apr 28 22.5h SAST – Dave Blane, Johannesburg. V = 7.7
- 2014 Apr 26 23.6h SAST – Dave Blane, Johannesburg. V = 7.7
- 2014 Apr 25 21.7h SAST – Dave Blane, Johannesburg. V = 7.8
- 2014 Apr 24 19.8h SAST – Dave Blane, Johannesburg. V = 7.7
- 2014 Apr 23 19.8h SAST – Dave Blane, Johannesburg. V = 7.7
- 2014 Apr 22 19.7h SAST – Dave Blane, Johannesburg. V = 7.7
- 2014 Apr 21 20.5h SAST – Dave Blane, Johannesburg. V = 7.7
- 2014 Apr 20 20.5h SAST – Dave Blane, Johannesburg. V = 7.7
- 2014 Apr 19 19.0h SAST – Dave Blane, Johannesburg. V = 7.7
- 2014 Apr 18 18.5h SAST – Dave Blane, Johannesburg. V = 7.8
- 2014 Apr 17 20.3h SAST – Dave Blane, Johannesburg. V = 7.8
- 2014 Apr 16 18.5h SAST – Dave Blane, Johannesburg. V = 7.7
- 2014 Apr 15 18.5h SAST – Dave Blane, Johannesburg. V = 7.6
- 2014 Apr 14 20.5h SAST – Dave Blane, Johannesburg. V = 7.6
- 2014 Apr 12 19.0h SAST – Dave Blane, Johannesburg. V = 7.5
- 2014 Apr 11 22.5h SAST – Dave Blane, Johannesburg. V = 7.5
- 2014 Apr 10 21.5h SAST – Dave Blane, Johannesburg. V = 7.6
- 2014 Apr 09 22.5h SAST – Dave Blane, Johannesburg. V = 7.7
- 2014 Apr 08 21.5h SAST – Dave Blane, Johannesburg. V = 7.6
- 2014 Apr 07 20.6h SAST – Dave Blane, Johannesburg. V = 7.5
- 2014 Apr 06 22.6h SAST – Dave Blane, Johannesburg. V = 7.4
- 2014 Apr 05 22.3h SAST – Dave Blane, Johannesburg. V = 7.5
- 2014 Apr 04 22.5h SAST – Dave Blane, Johannesburg. V = 7.5
- 2014 Apr 03 20.2h SAST – Dave Blane, Johannesburg. V = 7.5
- 2014 Apr 02 20.3h SAST – Dave Blane, Johannesburg. V = 7.5
- 2014 Apr 01 21.3h SAST – Dave Blane, Johannesburg. V = 7.4
- 2014 Mar 31 21.3h SAST – Dave Blane, Johannesburg. V = 7.3
- 2014 Mar 30 20.6h SAST – Dave Blane, Johannesburg. V = 7.2
- 2014 Mar 29 21.5h SAST – Dave Blane, Johannesburg. V = 7.3
- 2014 Mar 28 22.5h SAST – Dave Blane, Johannesburg. V = 7.3
- 2014 Mar 27 20.5h SAST – Dave Blane, Johannesburg. V = 7.3
- 2014 Mar 25 20.5h SAST – Dave Blane, Johannesburg. V = 7.3
- 2014 Mar 24 20.7h SAST – Dave Blane, Johannesburg. V = 7.2
- 2014 Mar 23 22.3h SAST – Dave Blane, Johannesburg. V = 7.1
- 2014 Mar 21 20.1h SAST – Dave Blane, Johannesburg. V = 7.2
- 2014 Mar 20 20.5h SAST – Dave Blane, Johannesburg. V = 7.4
- 2014 Mar 19 20.5h SAST – Dave Blane, Johannesburg. V = 7.5
- 2014 Mar 18 22.6h SAST – Dave Blane, Johannesburg. V = 7.4
- 2014 Mar 17 23.0h SAST – Dave Blane, Johannesburg. V = 7.4
- 2014 Mar 16 22.0h SAST – Dave Blane, Johannesburg. V = 7.3
- 2014 Mar 15 22.6h SAST – Dave Blane, Johannesburg. V = 7,4
- 2014 Mar 14 23.0h SAST – Dave Blane, Johannesburg. V = 7.3
- 2014 Mar 13 22.5h SAST – Dave Blane, Johannesburg. V = 7.2
- 2014 Mar 05 23.6h SAST – Dave Blane, Johannesburg. V = 7.6
- 2014 Feb 28 22.6h SAST – Dave Blane, Johannesburg. V = 7.3
- 2014 Feb 27 22.5h SAST – Dave Blane, Johannesburg. V = 7.1
- 2014 Feb 26 21.8h SAST – Dave Blane, Johannesburg. V = 7.1
- 2014 Feb 25 23.5h SAST – Dave Blane, Johannesburg. V = 6.9
- 2014 Feb 24 23.3h SAST – Dave Blane, Johannesburg. V = 7.0
- 2014 Feb 22 21.8h SAST – Dave Blane, Johannesburg. V = 6.9
- 2014 Feb 20 23.5h SAST – Dave Blane, Johannesburg. V = 6.9
- 2014 Feb 17 23.5h SAST – Dave Blane, Johannesburg. V = 6.6
- 2014 Feb 16 23.1h SAST – Dave Blane, Johannesburg. V = 6.4
- 2014 Feb 15 22.5h SAST – Dave Blane, Johannesburg. V = 6.5
- 2014 Feb 14 22.3h SAST – Dave Blane, Johannesburg. V = 6.5
- 2014 Feb 12 23.9h SAST – Dave Blane, Johannesburg. V = 6.2
- 2014 Feb 11 22.5h SAST – Dave Blane, Johannesburg. V = 6.0
- 2014 Feb 10 23.9h SAST – Dave Blane, Johannesburg. V = 6.3
- 2014 Feb 09 23.9h SAST – Dave Blane, Johannesburg. V = 6.2
- 2014 Feb 07 23.9h SAST – Dave Blane, Johannesburg. V = 6.1
- 2014 Feb 04 00.1h SAST – Dave Blane, Johannesburg. V = 6.1
- 2014 Jan 31 00.1h SAST – Dave Blane, Johannesburg. V = 6.0
- 2014 Jan 29 00.9h SAST – Dave Blane, Johannesburg. V = 5.7
- 2014 Jan 27 04.4h SAST – Auke Slotegraaf, Somerset West. V = 5.97 +/- 0.07
- 2014 Jan 26 02.9h SAST – Auke Slotegraaf, Somerset West. V = 5.68 +/- 0.06
- 2014 Jan 23 23.6h SAST – Dave Blane, Johannesburg. V = 5.6
- 2014 Jan 22 23.5h SAST – Dave Blane, Johannesburg. V = 5.4
- 2014 Jan 22 04.0h SAST – Auke Slotegraaf, Somerset West. V = 5.31 +/- 0.06
- 2014 Jan 21 03.3h SAST – Auke Slotegraaf, Somerset West. V = 5.31 +/- 0.05
- 2014 Jan 20 03.3h SAST – Auke Slotegraaf, Somerset West. V = 5.19 +/- 0.01
- 2014 Jan 19 23.9h SAST – Dave Blane, Johannesburg. V = 5.3
- 2014 Jan 19 03.8h SAST – Auke Slotegraaf, Somerset West. V = 5.18 +/- 0.01
- 2014 Jan 18 01.5h SAST – Auke Slotegraaf, Somerset West. V = 5.19 +/- 0.01
- 2014 Jan 17 23.6h SAST – Dave Blane, Johannesburg. V = 5.2
- 2014 Jan 17 04.5h SAST – Auke Slotegraaf, Somerset West. V = 5.14 +/- 0.01
- 2014 Jan 16 23.6h SAST – Dave Blane, Johannesburg. V = 5.3
- 2014 Jan 16 03.4h SAST – Auke Slotegraaf, Somerset West. V = 4.94 +/- 0.01
- 2014 Jan 14 23.7h SAST – Dave Blane, Johannesburg. V = 5.0
- 2014 Jan 14 03.9h SAST – Auke Slotegraaf, Somerset West. V = 5.06 +/- 0.01
- 2014 Jan 13 23.8h SAST – Dave Blane, Johannesburg. V = 4.6
- 2014 Jan 13 04.4h SAST – Auke Slotegraaf, Somerset West. V = 4.61 +/- 0.02
- 2014 Jan 12 23.1h SAST – Dave Blane, Johannesburg. V = 4.8
- 2014 Jan 12 04.4h SAST – Auke Slotegraaf, Somerset West. V = 4.79 +/- 0.02
- 2014 Jan 11 23.8h SAST – Dave Blane, Johannesburg. V = 4.9
- 2014 Jan 11 02.9h SAST – Auke Slotegraaf, Somerset West. V = 4.93 +/- 0.02
- 2014 Jan 10 23.7h SAST – Dave Blane, Johannesburg. V = 5.0
- 2014 Jan 04 23.9h SAST – Dave Blane, Johannesburg. V = 4.5
- 2014 Jan 04 02.0h SAST – Dave Blane, Johannesburg. V = 4.7
- 2014 Jan 03 04.4h SAST – Auke Slotegraaf, Somerset West. V = 4.85 +/- 0.05.
- 2014 Jan 02 00.2h SAST – Dave Blane, Johannesburg. V = 5.3
- 2014 Jan 02 04.0h SAST – Auke Slotegraaf, Somerset West. V = 5.23 +/- 0.02.
- 2014 Jan 01 01.9h SAST – Dave Blane, Johannesburg. V = 5.0
- 2014 Jan 01 03.9h SAST – Auke Slotegraaf, Somerset West. V = 4.89 +/- 0.03.
- 2013 Dec 31 02.2h SAST – Dave Blane, Johannesburg. V = 5.0
- 2013 Dec 30 03.6h SAST – Auke Slotegraaf, Somerset West. V = 4.56 +/- 0.05.
- 2013 Dec 28 00.5h SAST – Dave Blane, Johannesburg. V = 4.2
- 2013 Dec 27 03h SAST – Peter Wedepohl, Somerset West. V = 4.3.
- 2013 Dec 27 01.8h SAST – Auke Slotegraaf, Somerset West. V = 4.15 +/- 0.09.
- 2013 Dec 24 03.3h SAST – Auke Slotegraaf, Somerset West. V = 4.45 +/- 0.06.
- 2013 Dec 23 03.5h SAST – Auke Slotegraaf, Somerset West. V = 4.47 +/- 0.08.
- 2013 Dec 23 00.8h SAST – Dave Blane, Johannesburg. V = 4.5.
- 2013 Dec 22 03h SAST – Jerome Jooste, Johannesburg. V = [4.3,5.0]
- 2013 Dec 22 03h SAST – Peter Wedepohl, Somerset West. V = 4.8.
- 2013 Dec 22 03.3h SAST – Auke Slotegraaf, Somerset West. V = 4.57.
- 2013 Dec 21 01.0h SAST – Dave Blane, Johannesburg. V = 5.0.
- 2013 Dec 21 03h SAST – Peter Wedepohl, Somerset West. V = 5.1.
- 2013 Dec 21 03.8h SAST – Auke Slotegraaf, Somerset West. V = 4.9.
- 2013 Dec 20 04.0h SAST – Auke Slotegraaf, Somerset West. V = 4.7.
- 2013 Dec 20 03h SAST – Peter Wedepohl, Somerset West. V = 5.1.
- 2013 Dec 20 04.5h SAST – Auke Slotegraaf, Somerset West. [photos]
- 2013 Dec 19 03.8h SAST – Bruce Tomalin, Durban. V = 5.2.
- 2013 Dec 19 03h SAST – Peter Wedepohl, Somerset West. V = 5.0.
- 2013 Dec 19 00h.9 SAST – Auke Slotegraaf, Somerset West. V = 5.1.
- 2013 Dec 18 03h SAST – Peter Wedepohl, Somerset West. V = 4.8.
- 2013 Dec 17 04.0h SAST – Auke Slotegraaf, Somerset West. V = 4.8.
- 2013 Dec 16 03.5h SAST – Peter Wedepohl, Somerset West. V = 4.5.
- 2013 Dec 16 04.0h SAST – Auke Slotegraaf, Somerset West. V = 4.4. [photos]
- 2013 Dec 15 03.8 h SAST – Kos Coronaios, Louis Trichardt. V ~ 3.2. [photos]
- 2013 Dec 15 02.3h SAST – Hannes Pieterse, Bloemfontein. V = 4.1.
- 2013 Dec 15 01.3h SAST – Dave Blane, Johannesburg. V = 3.4.
- 2013 Dec 14 01.5h SAST – Dave Blane, Johannesburg. V = 3.6.
- 2013 Dec 14 04.6h SAST – Auke Slotegraaf, Somerset West. V = 3.3. [photos]
- 2013 Dec 13 02.3h SAST – Dave Blane, Johannesburg. V = 3.8.
- 2013 Dec 12 04 h SAST – Jerome Jooste, Johannesburg [spectrum]
- 2013 Dec 12 03.4 h SAST – Jerome Jooste, Johannesburg [photo]
- 2013 Dec 12 03.4 h SAST – Auke Slotegraaf (from Jerome Jooste’s photo). V = 4.3.
- 2013 Dec 12 04 h SAST – Kos Coronaios, Louis Trichardt. V = 4.1. [photos]
- 2013 Dec 11 04.0h SAST – Wim Filmalter, Riversdal [photo]
- 2013 Dec 11 02.5h SAST – Edward Foster, Brackenfell [photos]
- 2013 Dec 11 01.5h SAST – Auke Slotegraaf, Somerset West. V = 3.6. [photos]
- 2013 Dec 09 04.0h SAST – Carol Botha, Cape Town [Carol’s Facebook album] or [photo on psychohistorian.org]
- 2013 Dec 09 04.0h SAST – Auke Slotegraaf. V = 4.4 .
- 2013 Dec 07 03.0h SAST – Dave Blane, Johannesburg. V = 4.0.
- 2013 Dec 07 04.5h SAST – Auke Slotegraaf, Somerset West. V = 4.1. [(photos]
- 2013 Dec 05 01.5h SAST – Dave Blane, Johannesburg. V = 3.9.
- 2013 Dec 04 10.2h SAST – AAVSO Alert Notice 492. V = 4.35.
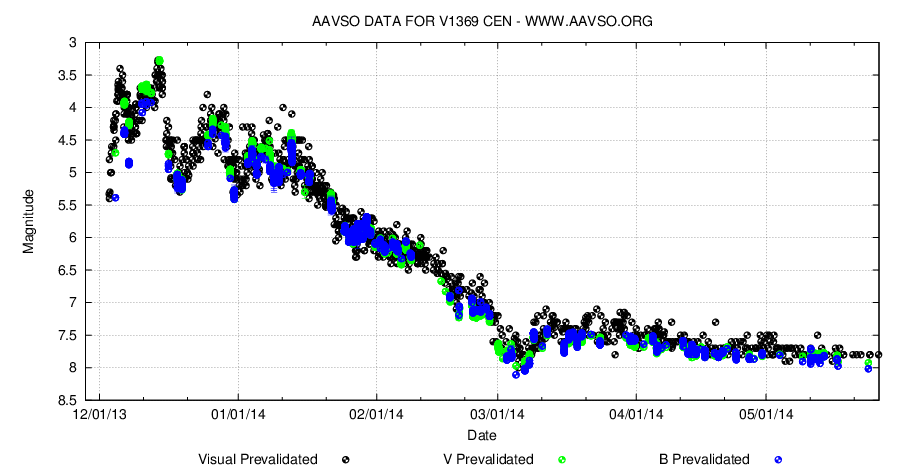
The AAVSO has a Nova Cen discussion page and also maintains a light curve for V1369 Cen, and welcomes new observations. The curve below shows recent observations (times are in UT):
Recent Astronomer’s Telegrams
- ATel #5685: ATCA detection of Nova Centauri 2013 (2013 Dec 22 22:59 UT)
- ATel #5653: Fermi-LAT Observations of Nova V1369 Centauri 2013 Brightening in Gamma rays (2013 Dec 12 21:36 UT)
- ATel #5649: Fermi-LAT Gamma-ray Observations of Nova Centauri 2013 (2013 Dec 10 21:42 UT)
- ATel #5639: Spectroscopic observations of Nova Cen 2013 (2013 Dec 08 12:39 UT)
- ATel #5628: XMM-Newton X-ray pre-nova detection and current Swift non-detection of PNV J13544700-5909080 (= Nova Cen 2013) (2013 Dec 04 16:59 UT)
- ATel #5621: Confirmation of PNV J13544700-5909080 and Identification of a Probable Progenitor (2013 Dec 03 11:17 UT)
Spectroscopy
Soon after the discovery was announced, spectroscopic results confirmed its nature. Find out more about these early results by visiting the Astronomical Spectroscopy for Amateurs YahooGroup.
A detailed discussion can be found in the ARAS Spectroscopy Forum for V1369 Cen.
Jerome Jooste has been taking spectra of the Nova; the example below is from December 16.
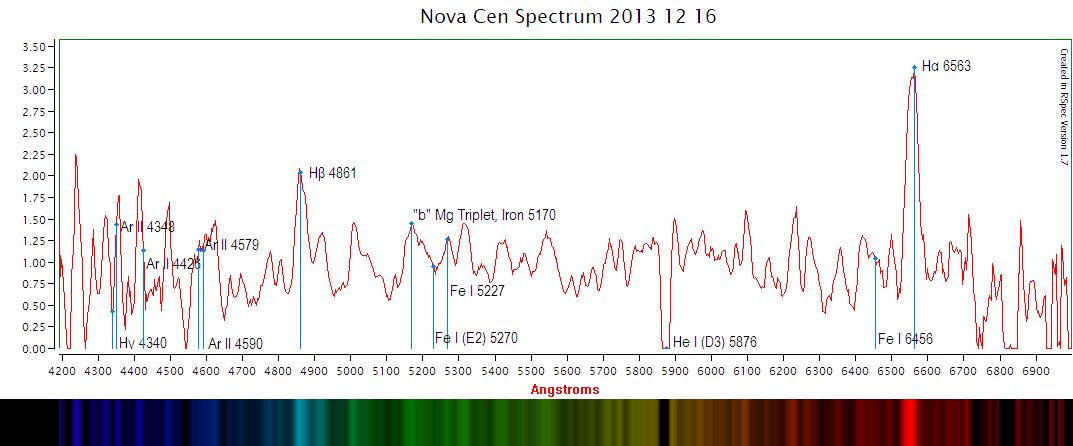
Jerome writes: “The spectrum profile shows the emission (peaking) and absorption (dipping ) lines of the elements that exist in the superheated expanding gas shell of the nova. In the early stages the shell is dense and opaque and we only see the ionised H alpha and the H beta as emission lines. As the shell expands it becomes less opaque (optically thinner) and we are able to see a little way into its interior albeit as if through a very dirty window. The next emission lines that became evident were those of the ionised Fe species. This is why it was quickly categorised as a Fe II type nova. The evolution of the nova has now reached a point where the expanding shell has become slightly more transparent due to a drop in density and we are able to now see the ionised He 1(D3) as indicated by that strong emission line in the current profile. As the ejecta becomes optically thinner there will be other ionised elements that become visible to the spectrograph. All nova are a bit of a prototype and so one is never quite sure of what may come next. The low resolution of the spectrograph I use will not be able to identify many of the latter lines as they are too closely compacted. Dust has not yet formed as the temperature is still too high. I have indicated some of the Argon lines but that is not significant. It was simply due to an article I read regarding the discovery of Argon in space. It was calculated that the gas shell is expanding at about 1100 km/s which is not terribly fast. The expanding shell of Nova Del 2013 was calculated at around 3000 km/s on the exterior.”
Find out more
Brian Skiff (Lowell Observatory, USA) has suggested that the possible progenitor star is 3UC 062-280459 (J2000.0 coordinates 13 54 45.35 -59 09 04.1), and notes that there is an XMM-Newton x-ray source 2″ away.
A team of Australian astronomers, using the Australia Telescope Compact Array (ATCA) radio telescope, estimate the distance to the nova to be approximately 3.3 kpc (11,000 light years). [See ATel #5685]
A recent (2010) paper by Richard Strope, Bradley Schaefer and Arne Henden presents a modern classification system for novae, based solely on the appearance of the light curves – “Catalog of 93 Nova Light Curves: Classification and Properties” can be downloaded from arXiv.
Join the Nova Hunt
Bradley Schaefer recently wrote: “… based on my calculations about half of all novae as bright as Nova Cen are missed, largely because they are in the south and often away from opposition. That is, in the last year, there was likely another nova, just as bright as Nova Cen, that nobody discovered. The professional surveys are useless for picking up bright novae, and so the task is entirely up to amateurs. The majority of these are south of Declination= -33°, and are solely the province of South African, Australian, and New Zealand amateurs.”
If you’re interested in joining in the hunt for the missing novae, please contact the Shallow Sky Director, Dave Blane.
While you’re up…
While in the area, take a moment to find some of the brilliant and less-brilliant deep-sky objects nearby:
Nova Cen 175