| Chronology of South African astronomy |
| A very handy Chronology_2021 (time-line) of astronomical and other events is available in a spreadsheet format. This website does not support the download of spreadsheets, so click on the link that will take you to a Google Drive Cloud facility where the spreadsheet is available. Click the link or copy the link https://drive.google.com/drive/folders/1vhhN4qZOfaLia8l4MJ30d-JngcKK4yLw?usp=sharing
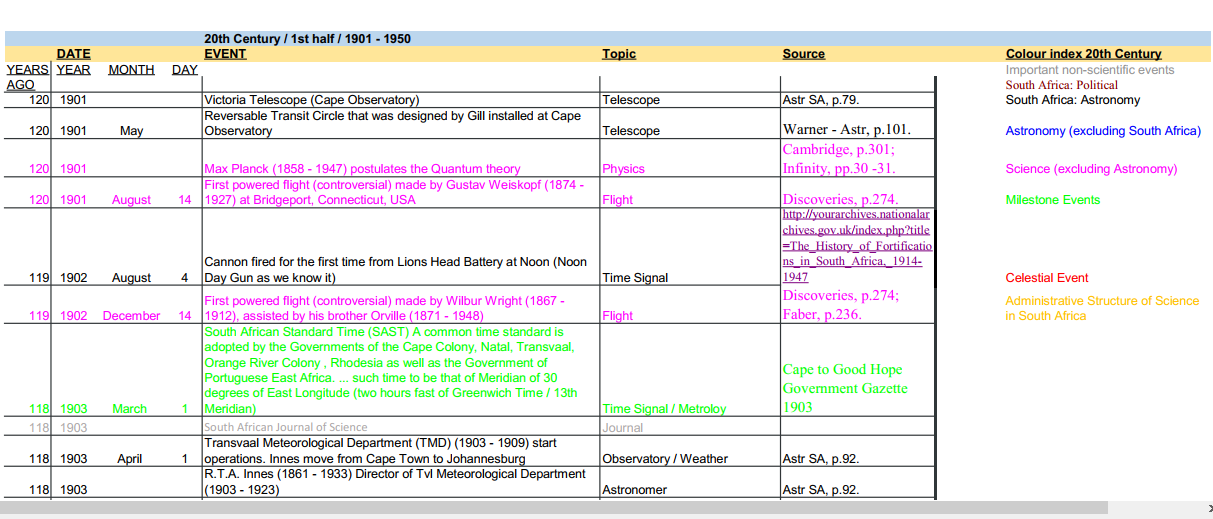
This Chronology contains two spreadsheets. The spreadsheet named “Chronology” contains world astronomical and science history, and focus from the 18th Century on South African astronomical history. The spreadsheet named “ASSA” focus on the history of the “Astronomical Society of South Africa”. In order to use the chronology properly it is suggested that you download the Chronology Blurb given below, print it out, and then read it with the spreadsheet open on your computer.
CHRONOLOGY Introduction: The chronology (time-line of events) has many uses but it is mainly intended to help the committees of societies plan for the year ahead. It is always important to be abreast of events, in this case to commemorate historical events. Hopefully this Chronology will answer the question: “what happened in the past that is relevant to the interest of your society?” If you open the spreadsheet on your computer and print this document, then it will be easier to follow the instructions / my intentions. The chronology is a set of events, dated in time-order. Because it is a spread sheet, it is pliable, and can be adapted as the need arises. Relevant events can be added, irrelevant events deleted. Point of reference Block A2 is the single most important reference point / date in the whole document. The date given should be the current year. Row A calculates how many years ago an event took place, using A2 as its reference. Therefore, to plan for next year, change the date in A2, and the spreadsheet will calculate in row A how many years ago an event took place. Layout: The layout is fairly straightforward. The information below is not given from the left to the right of the spreadsheet, but on the importance of each row.
If the document opened with all rows at the same width then it is easy to reset it to the intended width. The width is arbitrary and should be changed to suit the size of the computer screen. The intended widths are: Row A B C D E F G H I J Pixels 50 46 72 36 403 183 157 69 209 164 Intended Use: As an example you want to plan the society events for next year. It is important to know what events that happened in the past that is worth commemorating. People commemorate events on round numbers, i.e. an event that happened 399 years ago is not worth commemorating, but if it was 400 years ago, a nice round number, it is worth noting. Step one, go to Block E2 and change the date to next year. The year that an event happened is given in row B, but row A calculate how many years ago an event happened based on the year in E2. To find round numbers just scan row A and make notes of anything of interest. Colour index: Different events are in different colours to make it easier to find events of interest. The meaning of the colours are given in row I. The colour index change according to the needs of pre-scientific to the scientific era. In the pre-scientific era colours were allocated according to different geographical areas. Once the scientific era started geography was reduced to Southern Africa versus the rest of the world. (More under Southern African Bias) It is important to place events against their socio-economical background. For that reason the category “Important non-scientific events” (Grey colour) was created. This category becomes overbearing in places. Just delete those events according to your needs. Southern African and Astronomy Bias: This chronology appears on a website for the History of Astronomy in Southern Africa. Therefore events for the Southern African region have priority, and those events are colour indexed in black. Important astronomical events in the rest of the world are given in blue. Similarly, astronomy is the focus. Celestial events are in red. Astronomy is but one science. Important “other scientific” events have their own colour indexes. Summary: This chronology forms a useful database. It is pliable, feel free to adapt and expand on it. I realise that there may be important events that I omitted. If you are aware of any such omission, please inform me at history Thank you Chris de Coning |